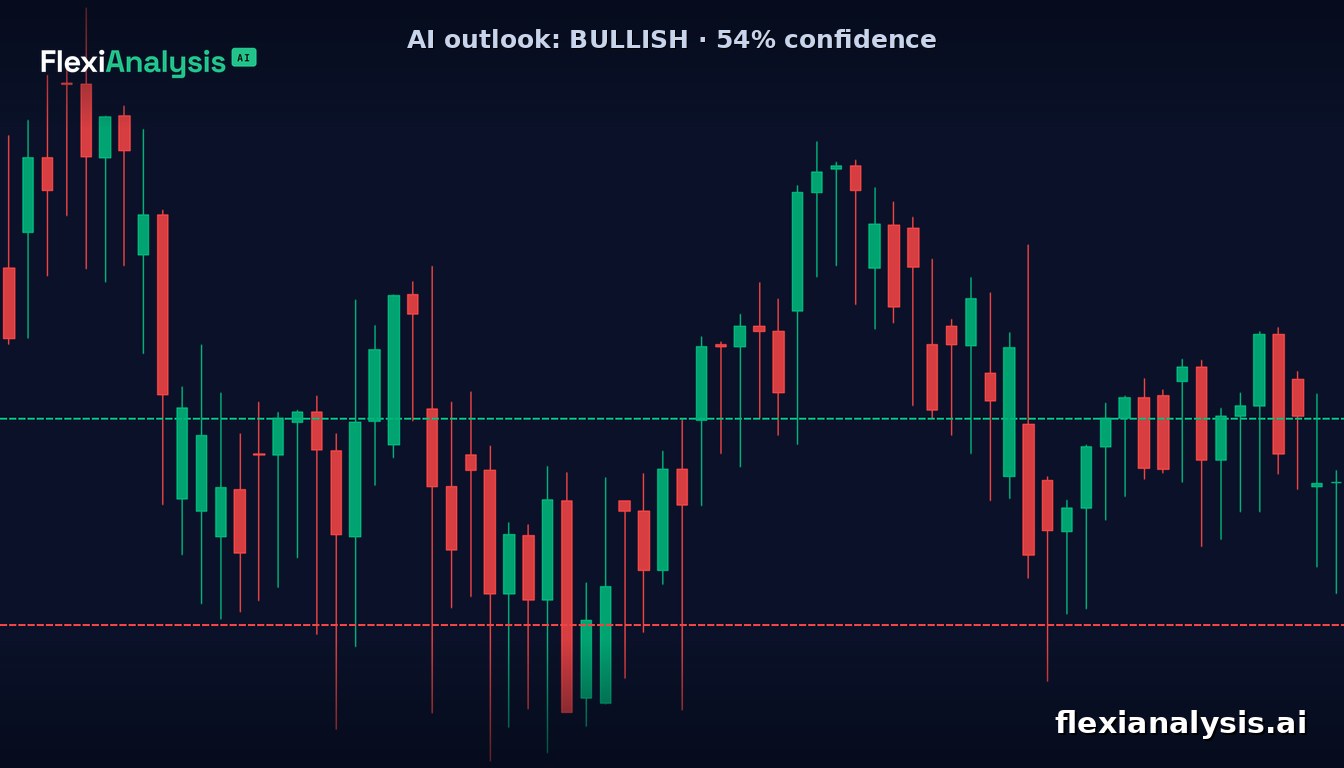
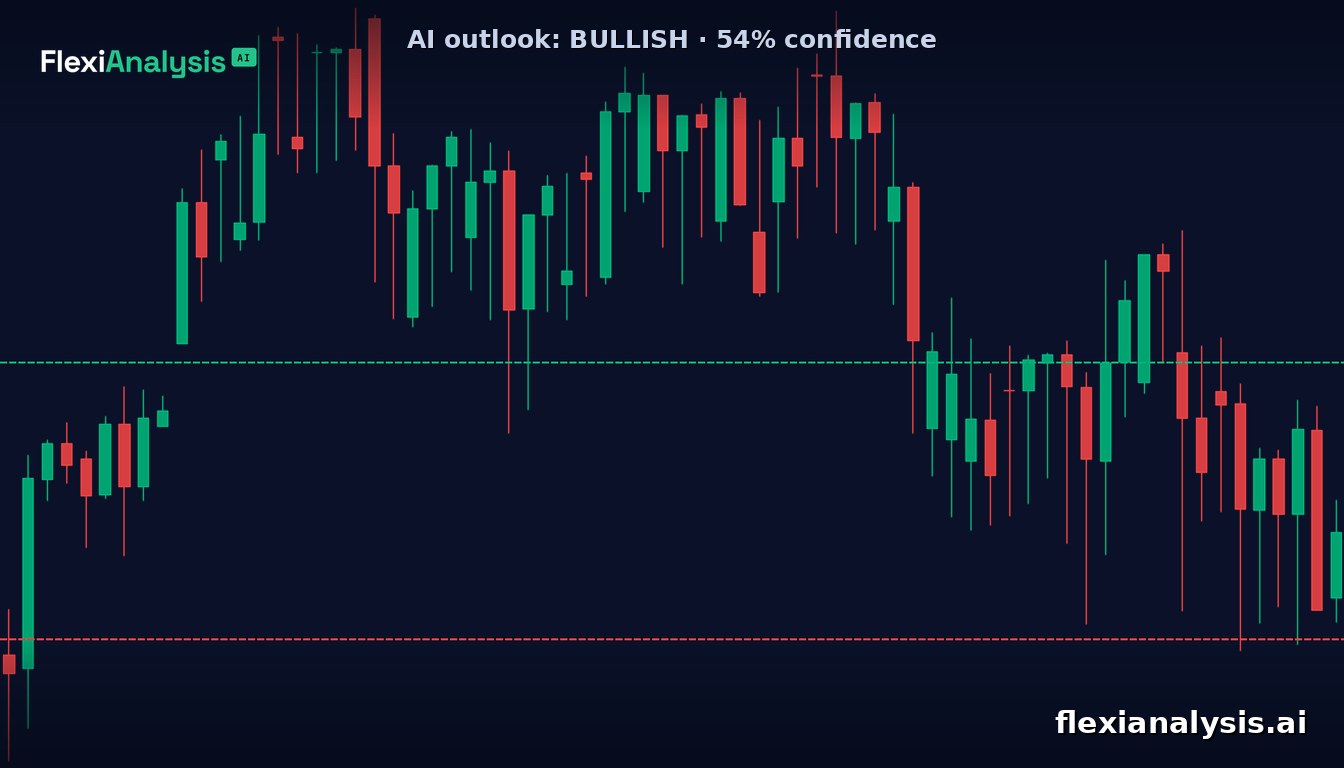
Our AI model leans bullish on the Nasdaq 100 at 54% confidence over 24 hours, targeting 29,840.51 from 29,665.00. Key support sits at 29,280.36; a break below invalidates the bias.
The Nasdaq 100 trades near 29,665.00 on July 7, 2026. Our trained neural-network model currently leans bullish with moderate conviction. Here's what the Nasdaq 100 forecast suggests for today.
Nasdaq 100 Forecast: The AI Model's Bullish Case
Our model expresses a bullish bias at 54% confidence over 24 hours. This sits just above neutral—not a strong signal, but a measured lean toward upside. The model's objective level is 29,840.51, representing a 175-point move from current levels.
A 54% confidence reading means two-sided risk exists. Roughly half the probability mass sits on downside scenarios. The Nasdaq 100 forecast is not a conviction call; it's a balanced tilt with meaningful downside risk acknowledged.
Our model incorporates price action, volatility, and momentum signals. Tech earnings, Fed commentary, and macro data drive daily moves. If you're tracking how our predictions perform, verified AI trading results show our model's historical edge on similar setups.
Support, Resistance, and Invalidation Levels
The critical invalidation level sits at 29,280.36—approximately 385 points below current price. If the Nasdaq 100 closes below this level, the bullish bias is wrong. A deeper correction may follow; reassess the entire technical picture.
This level acts as a floor. Breach it, and the bias fails. Between current price and the target, resistance clusters exist around 29,800–29,850, aligning with the model's objective. Support sits closer at 29,500–29,550; monitor this zone if intraday momentum falters.
For broader context, check our S&P 500 analysis to see how large-cap equities are positioned. The Nasdaq 100 often leads or lags the broader index based on growth-stock rotation.
What Invalidates This Bias?
The Nasdaq 100 remains sensitive to interest-rate expectations and growth narratives. Any surprise inflation data or central-bank signals can flip the bias quickly. Today's bias is valid until invalidation or a new close below support.
Watch the 29,280.36 level closely—it's your early warning that the bias has failed. Price action around 29,500–29,550 will also reveal intraday conviction. A sustained move below 29,500 suggests weakening bullish momentum.
Risk Acknowledgment: This is educational market commentary, not financial advice. Our model expresses probabilities, not certainties. The Nasdaq 100 can move against any forecast. Always use stop-losses and position sizing appropriate to your risk tolerance. For regulatory context on index trading, see Investopedia's Nasdaq 100 definition.
The bullish lean is modest but present. The invalidation level is your risk boundary. Trade with discipline and respect two-sided risk at all times.
FlexiAI provides analysis for educational purposes only, not financial advice. Trading involves significant risk of loss.